DATA ENGINEERING · PLATFORMS · ANALYTICS

Data that arrives.
Reliable by design.

I design reliable data pipelines and thoughtful architectures that move data efficiently, preserve its meaning, and make every destination ready for confident decisions.

FUTURE DIRECTION

Designing dependable AI data engineering systems that connect governed data, retrieval and intelligent automation.

Okang Michael Ozeh, Data Engineering and Analytics Specialist
01 / ABOUT ME

I build the layer between data and decisions.

I am Okang Michael Ozeh, a data engineering and analytics specialist focused on designing reliable pipelines, well-structured data platforms and analytics-ready models.

My work spans batch processing, real-time streaming, change data capture, lakehouse architecture, dimensional modelling and business intelligence. The goal is consistent: move data efficiently from source to destination while preserving its quality, meaning and traceability.

I approach every project as an engineering problem. I define the data grain, design for failure and recovery, test critical boundaries, and document the decisions that make each system dependable and understandable.

01Reliable by design
02Business-aware modelling
03Decisions documented
02 / GROWTH

My engineering loop

Understand the event. Protect its meaning. Separate fast operational paths from durable analytical ones. Test the boundaries. Make the result explainable. Then iterate.

Define the contractGrain, schema and qualityProtect meaning from the source
Engineer the flowBatch, streaming and CDCMove and recover data reliably
Serve trusted productsLakehouse, models and BIDeliver analytics-ready outputs
Extend into intelligenceNext: RAG and AI pipelinesGround retrieval in governed data
03 / TOOLKIT

Core toolkit

PythonSQLPySparkKafkaDatabricksDelta LakedbtAirflowSnowflakeBigQueryPostgreSQLPower BIDAXDockerGitHub Actions
04 / PORTFOLIO

Systems, built end to end.

Two focused tracks covering reliable data platforms and decision-ready analytics products.

00 / NEXT BUILD

Upcoming Platform Architecture

Project Danube defines the governed CDC platform planned for the next implementation cycle.

Project Danube: End-to-end CDC architecture01
Figures01 / 02
End-to-end CDC architecture
Proposed governed CDC data platform

Project Danube

Next proposed project

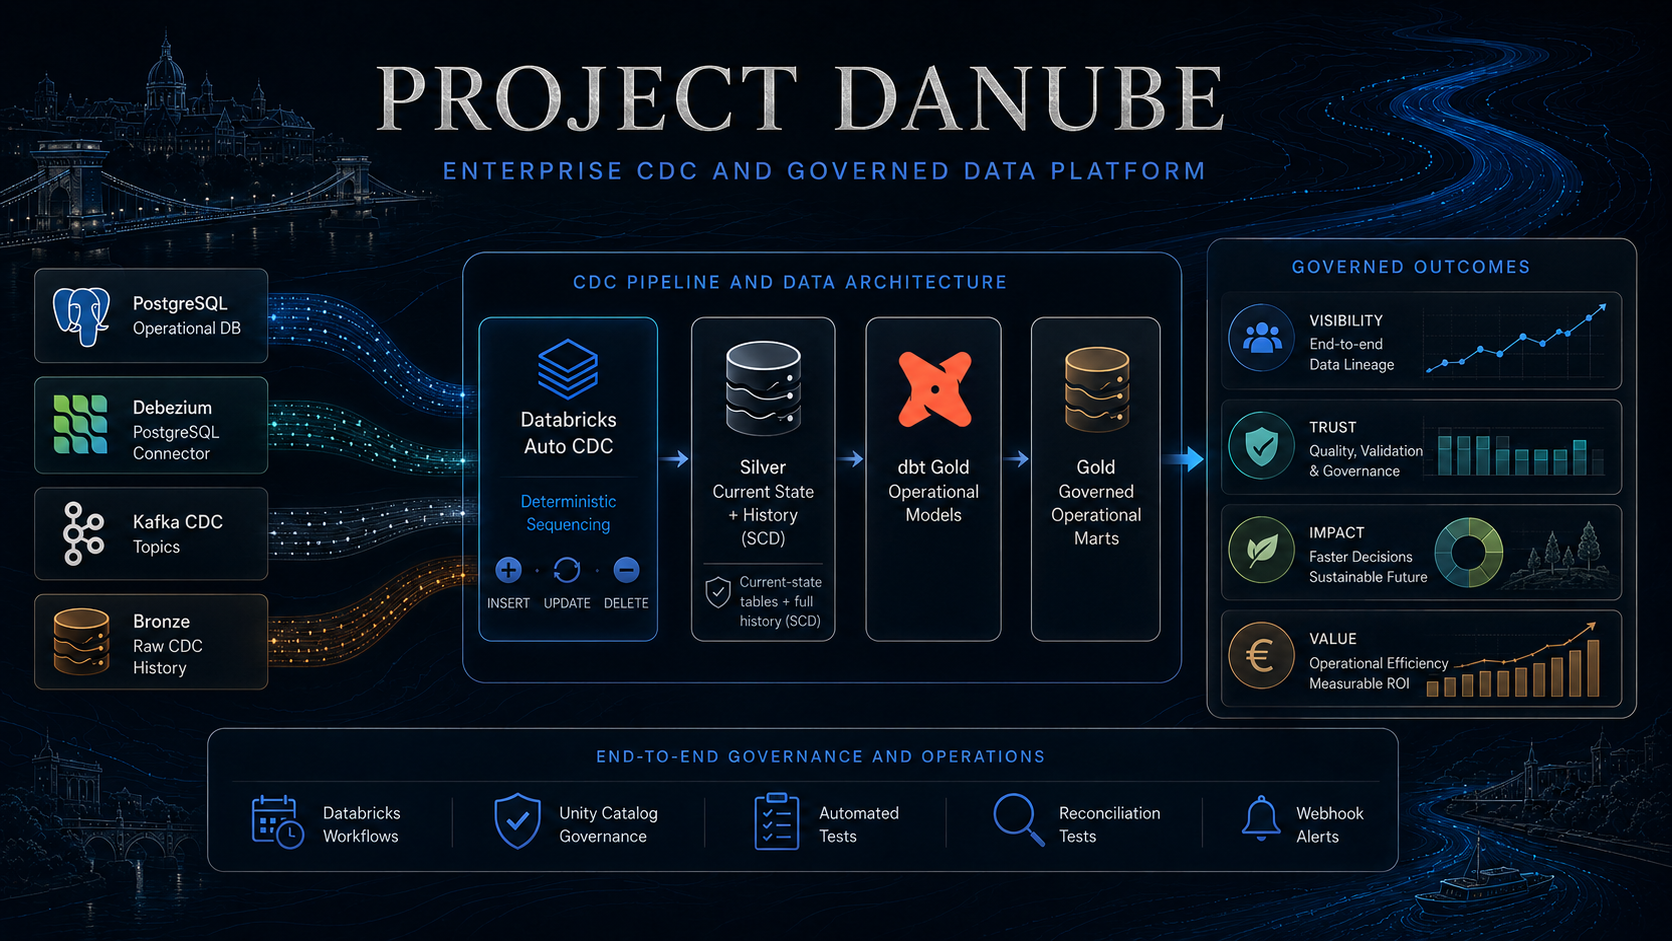
A proposed enterprise CDC and analytics platform that captures inserts, updates and deletes from a simulated retail application, preserves raw history, resolves trustworthy current state and SCD history, and delivers governed business data products.

Design challenge

Interpreting insert, update and delete events correctly when changes arrive late, repeat or appear out of order, while preserving an auditable raw history.

Proposed approach

Separate immutable Bronze history from Silver state resolution. Use Spark Structured Streaming or Auto CDC to deduplicate changes, apply deterministic sequencing, maintain current state and build SCD history before dbt creates Gold marts.

Expected value

Project Danube is designed to turn PostgreSQL retail changes into an auditable CDC platform with immutable Bronze history, deterministic Silver state and governed Gold data products.

PostgreSQLDebeziumKafkaAuto CDCdbtUnity Catalog
01 / BUILT SYSTEMS

Data Engineering Platforms

Implemented streaming and batch systems that moved, recovered and served data reliably.

Project Alpine: Platform architecture02
Figures01 / 02
Platform architecture
Real-Time Trade Alerting Lakehouse

Project Alpine

Flagship system

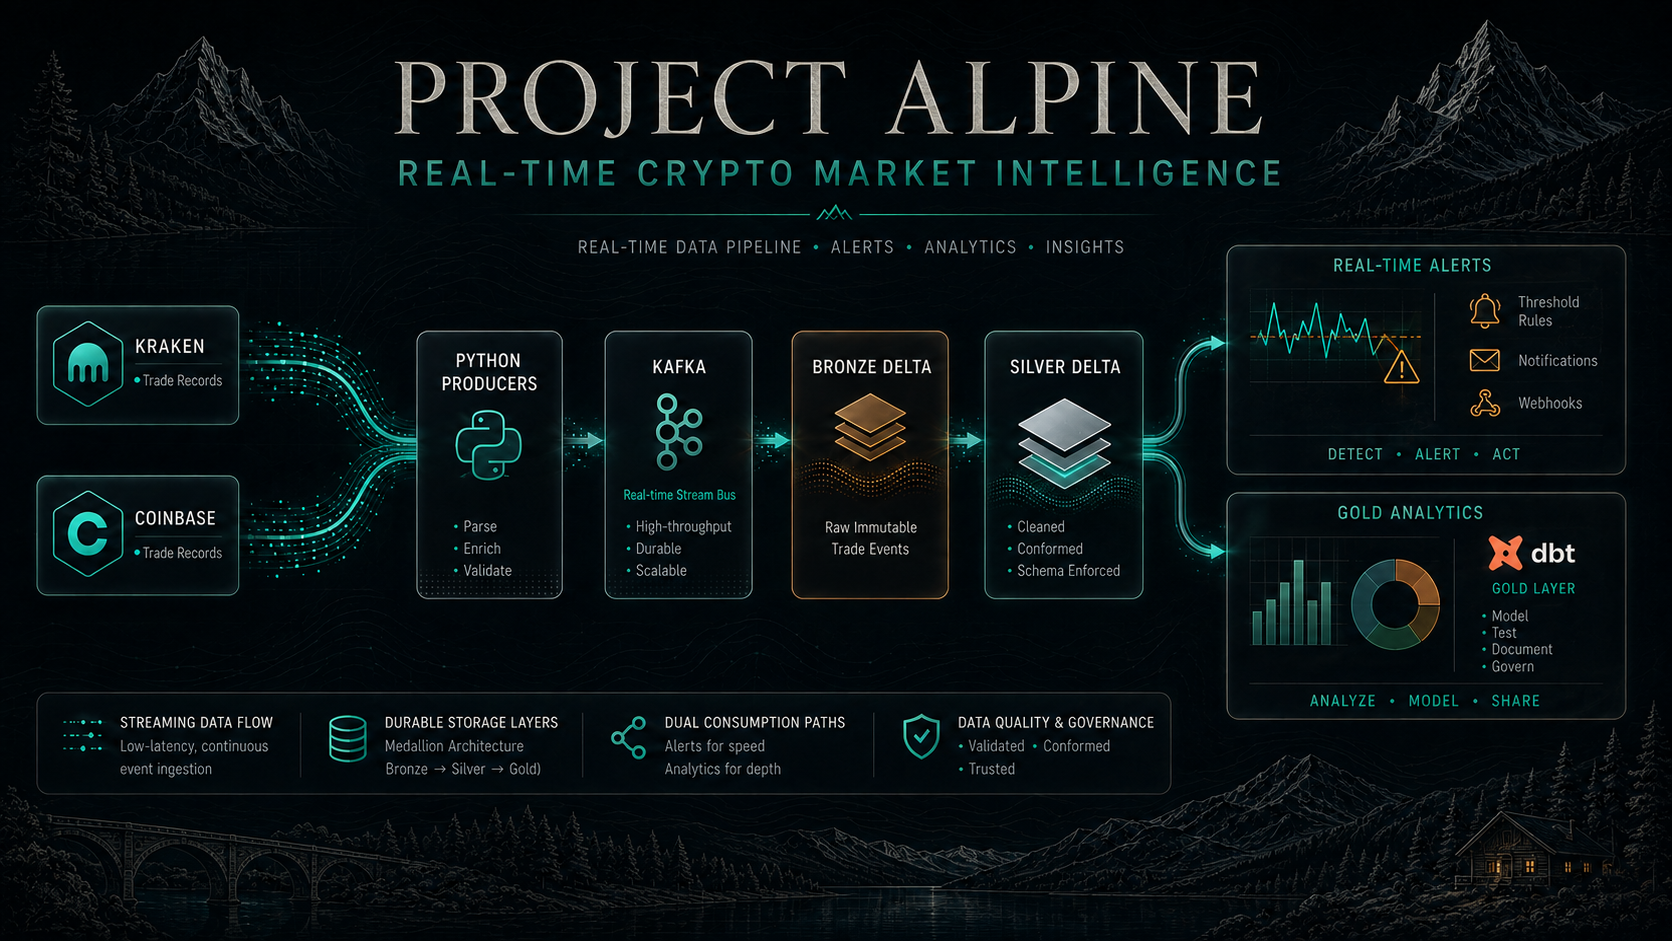
A production-grade streaming lakehouse moved transaction-level Kraken and Coinbase trades through Confluent Cloud Kafka into a Medallion architecture. PySpark Structured Streaming performed stateful deduplication and continuous Bronze/Silver ingestion. This created one trusted Silver contract for operational alerting, dimensional modelling and business analytics.

The challenge

The challenge was to build a scalable cloud pipeline while controlling development compute costs and protecting a consistent trade-level grain. Bitpanda returned stateless asset-price snapshots, not complete trade records, so it could not satisfy the shared Silver contract.

The solution

The ingestion and transformation logic was validated locally with Dockerized open-source tools. Kraken and Coinbase were retained as compatible trade sources, and the proven codebase was then deployed to Databricks and orchestrated with Workflows.

Signals, outcomes & lessons

Project Alpine unified live Kraken and Coinbase trades in a governed Delta Lakehouse, then served the trusted Silver stream to low-latency alerts, dimensional models and eight dbt Gold marts.

Architecture & data flow

Independent Python producers validated Kraken and Coinbase trade records and published each exchange to its own Kafka topic. Spark continuously normalized those streams into Bronze and a shared Silver Delta contract. Silver then served a low-latency alert path through Webhook/API, a dimensional model centred on fact_market_trades with asset, exchange and time dimensions, and dbt Gold marts for analytics users.

Learning outcomes
  • Developed stateful PySpark Structured Streaming and continuous DataFrame transformations.
  • Orchestrated dependencies, scheduling and execution with Databricks Workflows.
  • Applied a cost-aware SDLC that separated local validation from cloud deployment.
Evidence at a glance

2 independent exchange streams · 3 Silver consumption paths · 8 business-facing Gold marts

Delivered Gold analyticsBusiness-facing marts delivered from the trusted Silver contract
  • latest_market_prices
  • arbitrage_opportunities
  • hourly_ohlc
  • exchange_spread_history
  • market_volatility
  • stale_feed_monitor
  • data_quality_summary
  • market_activity
Signals, outcomes & lessons
  • Project Alpine unified live Kraken and Coinbase trades in a governed Delta Lakehouse, then served the trusted Silver stream to low-latency alerts, dimensional models and eight dbt Gold marts.
  • One producer and one raw Kafka topic per exchange isolated schema or source failures and made new exchanges easier to add.
  • The shared Silver contract scaled independently into alerting, dimensional modelling and Gold analytics without coupling their workloads.
PythonKafkaSparkDatabricksDelta Lakedbt
Open repository
Vienna Transit Pipeline: Pipeline architecture03
Figures01 / 04
Pipeline architecture
Cloud batch data platform

Vienna Transit Pipeline

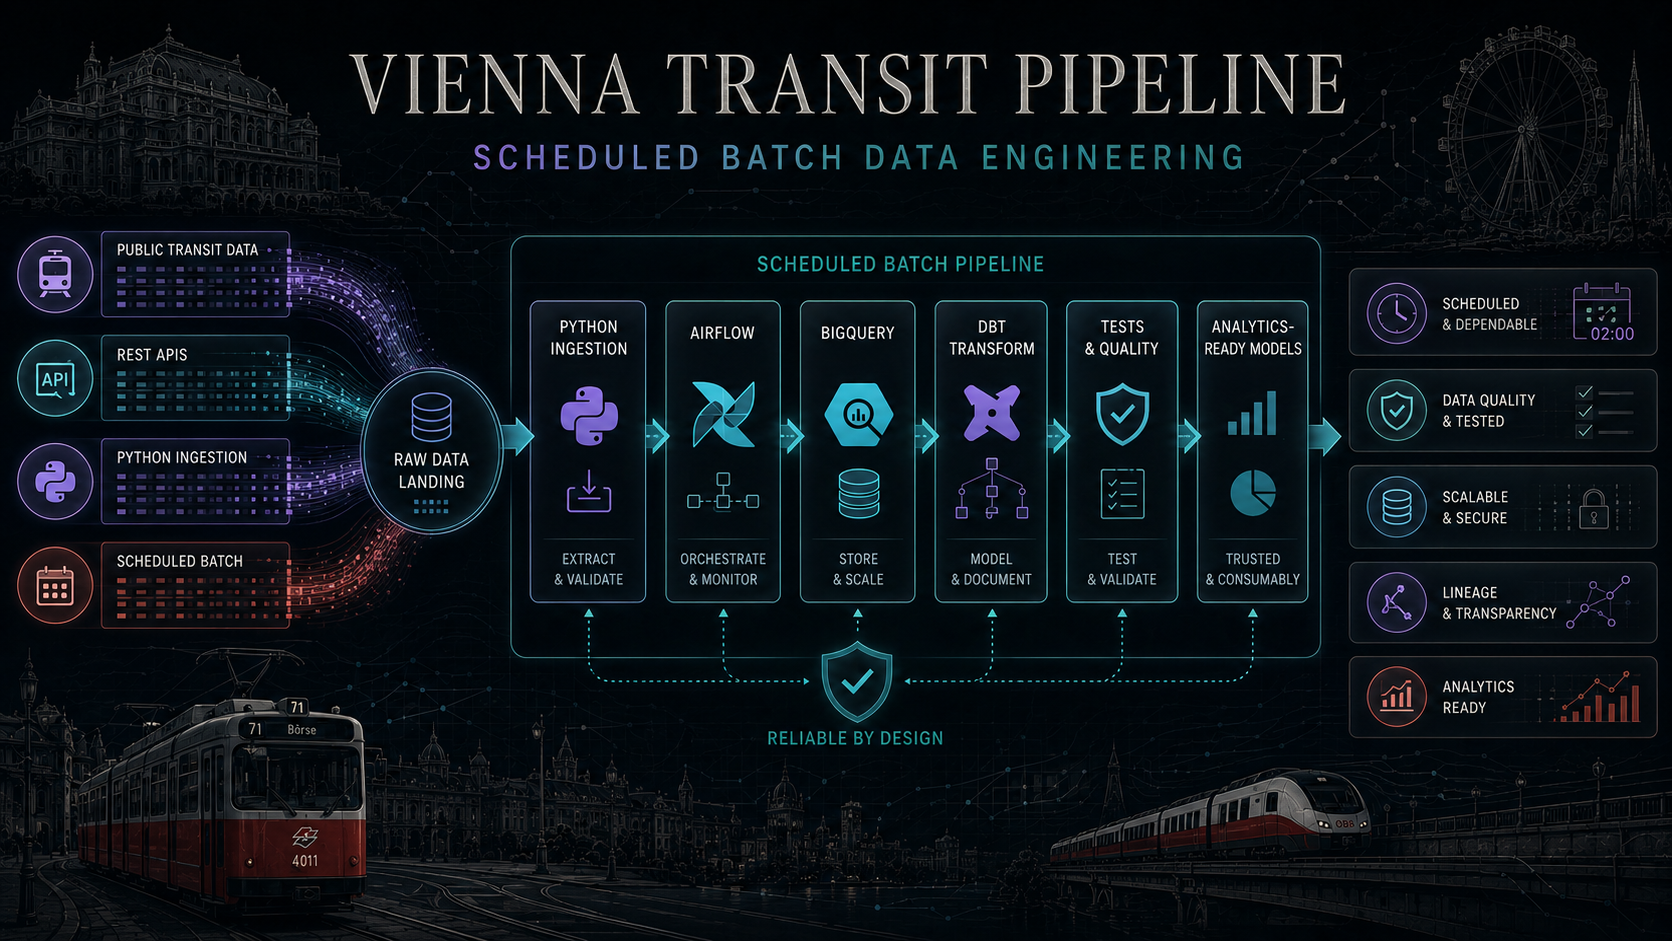
An end-to-end batch pipeline that pulls urban transit data from external REST APIs on a schedule, loads discrete raw files into BigQuery and uses dbt to produce clean, query-ready analytical models.

The challenge

The initial transit-source logic assumed human-readable line labels such as U1 to U6 could identify every station. The official route dataset instead uses numeric LineID values, so the first approach could not reliably resolve the complete network.

The solution

Made Airflow the central control plane with strict task dependencies. The backend intentionally ends at dbt run, cleanly separating dependable model preparation from any downstream BI or visualization layer.

Signals, outcomes & lessons

Vienna Transit Pipeline coordinated REST extraction, BigQuery loading and dbt modelling through Airflow, producing a repeatable backend flow with guarded dependencies and visible lineage.

Architecture & data flow

Public transit data is ingested with Python, scheduled and monitored through Airflow, stored in BigQuery and transformed with dbt into documented, analytics-ready models with visible lineage.

Learning outcomes
  • Apache Airflow DAGs for coordinating dependent batch tasks.
  • ELT design that decouples extraction from downstream transformation.
  • Modular, version-controlled SQL modelling with dbt.
Evidence at a glance

4 core pipeline stages · 1 orchestration control plane · 0 BI dependencies in the backend

Signals, outcomes & lessons
  • Vienna Transit Pipeline coordinated REST extraction, BigQuery loading and dbt modelling through Airflow, producing a repeatable backend flow with guarded dependencies and visible lineage.
  • Layered transformations made failures easier to isolate and rerun.
  • Scheduling, lineage and testing turned an analysis into a repeatable data product.
PythonAirflowBigQuerydbtDocker
Open repository
Cart Abandonment Engine: Streaming architecture04
Figures01 / 04
Streaming architecture
Real-time e-commerce streaming

Cart Abandonment Engine

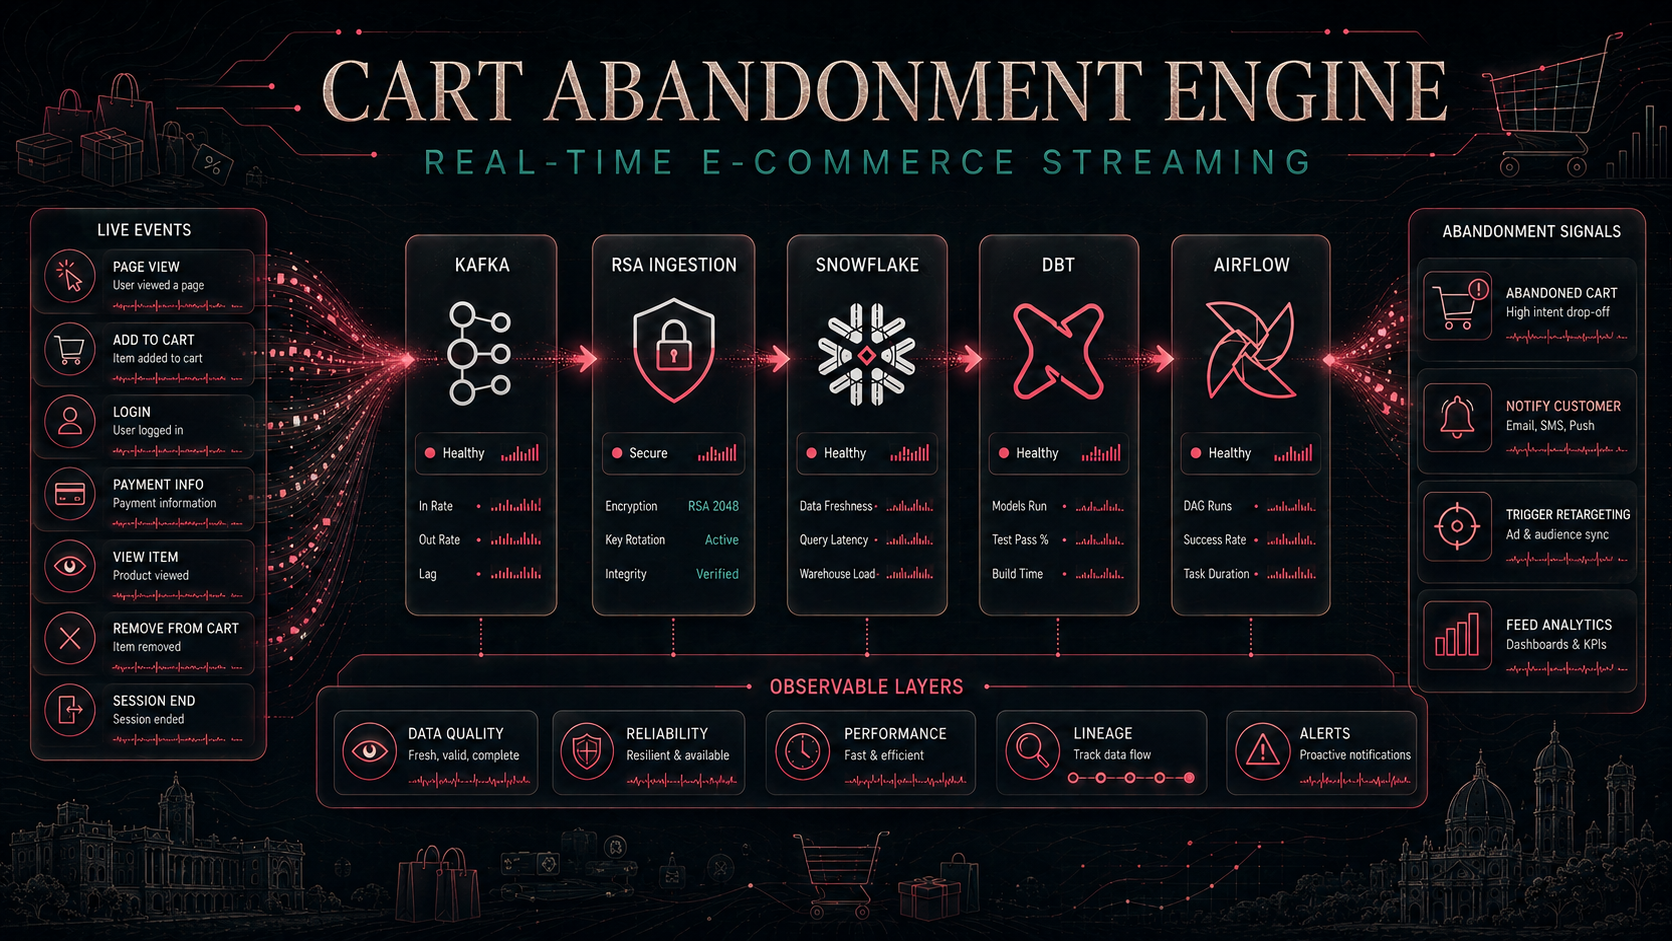
A continuous event-driven pipeline that captures explicit e-commerce actions such as added_to_cart as JSON events in Kafka, ingests the live stream into Snowflake and incrementally models it with dbt for immediate business consumption.

The challenge

Handling a continuous firehose of user events without maintaining Python extractors that repeatedly poll a server.

The solution

Replaced API polling with Kafka and Snowflake-native ingestion. Airflow was narrowed to orchestrating high-frequency dbt micro-batches, keeping capture, loading and transformation decoupled and observable.

Signals, outcomes & lessons

Cart Abandonment Engine replaced polling with Kafka and Snowflake-native ingestion, then modelled live cart events into actionable abandonment signals with dbt.

Architecture & data flow

E-commerce click and cart events enter Kafka, load into Snowflake and pass through dbt models that identify abandonment behaviour. Airflow coordinates the warehouse workflow and exposes observable task boundaries.

Learning outcomes
  • Continuous event-streaming architecture beyond scheduled batch jobs.
  • Secure machine-to-machine authentication using RSA key pairs.
  • Decoupled capture of explicit business events without polling or CDC.
Evidence at a glance

4 decoupled platform layers · 0 source polling loops · 1 actionable abandonment product

Signals, outcomes & lessons
  • Cart Abandonment Engine replaced polling with Kafka and Snowflake-native ingestion, then modelled live cart events into actionable abandonment signals with dbt.
  • Each layer exposed its own freshness, success and latency signals.
  • RSA key-pair authentication protected machine-to-machine access between the streaming and warehouse layers.
KafkaSnowflakedbtAirflowPython
Open repository
02 / DECISION SYSTEMS

Data Analytics & BI Projects

Modelled datasets and decision products that turned trusted data into measurable business insight.

Chocolate Sales Analytics: Analytics workflow05
Figures01 / 04
Analytics workflow
End-to-end BI pipeline

Chocolate Sales Analytics

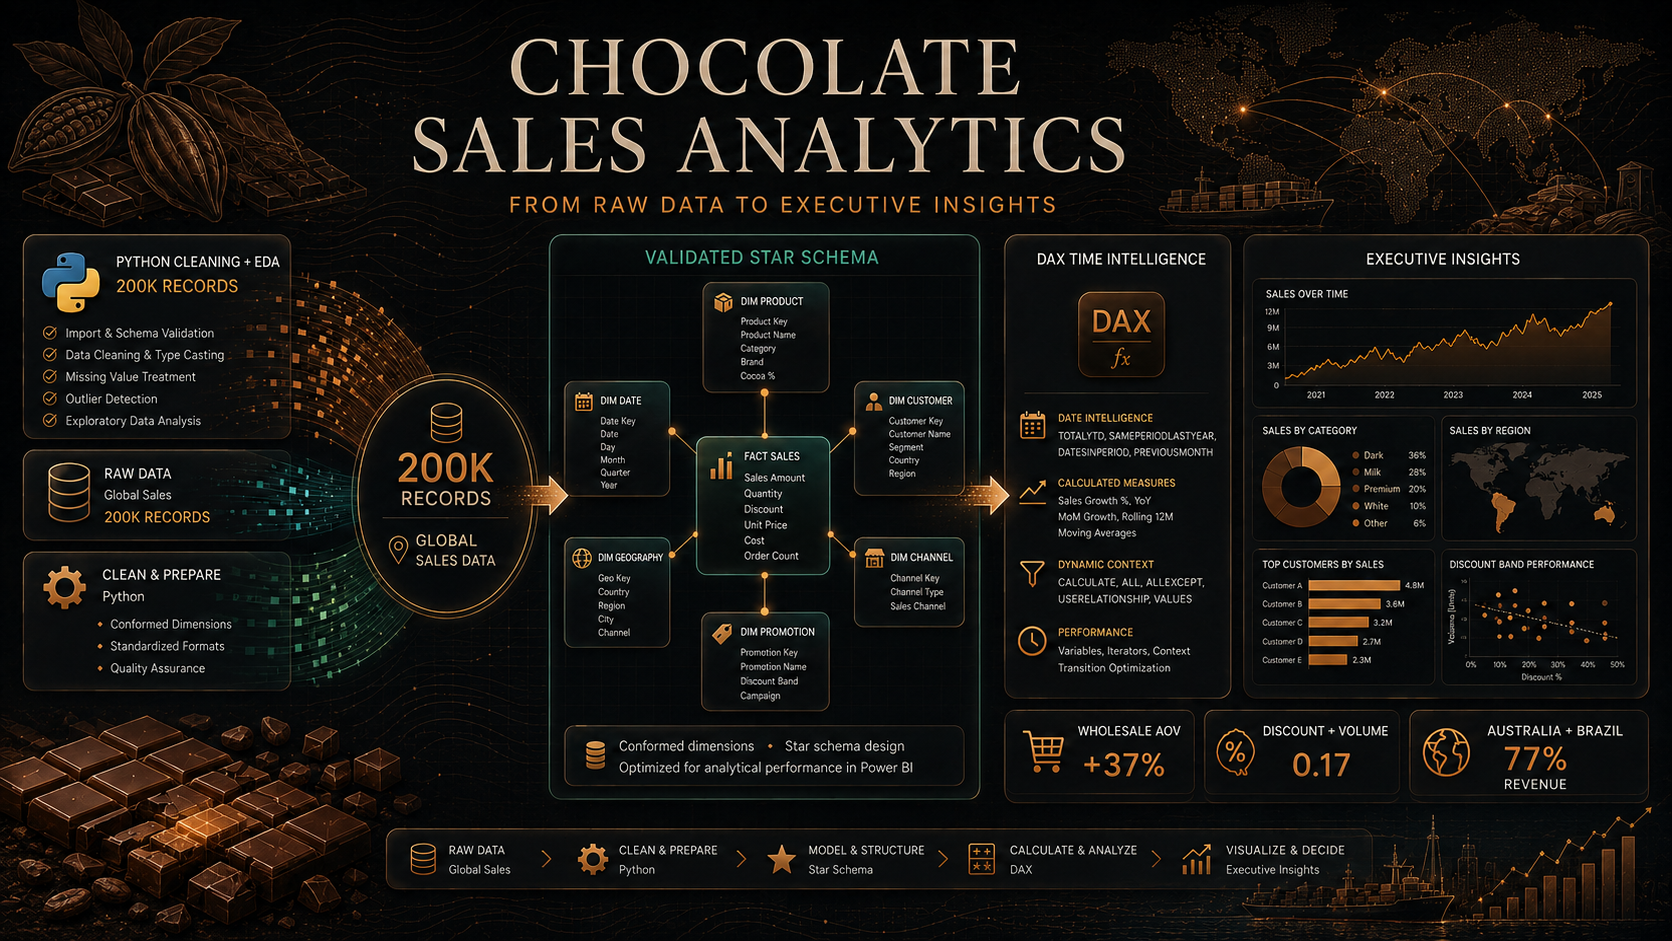
An end-to-end data preparation pipeline that cleans and structures roughly 200K transactional sales records into a performant star schema. The backend transformation layer produces unified, mathematically consistent fact and dimension tables for downstream analytical consumption.

The challenge

Structuring disparate sales and product records into a performant analytical model without duplication or broken relationships.

The solution

Built a strict transformation layer for deduplication, foreign-key validation and precise metric aggregation. A faulty Boxes_Shipped tolerance that silently removed valid high-density orders was audited and corrected.

Signals, outcomes & lessons

Chocolate Sales Analytics transformed roughly 200K transactions into a validated star schema that supported reusable DAX measures and revealed 37% higher Wholesale order value and 77% revenue concentration in Australia and Brazil.

Architecture & data flow

Python handles data profiling, cleaning and exploratory analysis across roughly 200K records. A Power BI star schema replaces flat-file reporting, while reusable DAX measures provide time intelligence and executive KPIs.

Learning outcomes
  • Scalable star-schema design for analytical workloads.
  • Data-quality rules across interconnected fact and dimension tables.
  • Backend transformation architecture for complex business logic.
Evidence at a glance

~200K transaction records modelled · +37% Wholesale average order value · 77% revenue from Australia and Brazil

Signals, outcomes & lessons
  • Chocolate Sales Analytics transformed roughly 200K transactions into a validated star schema that supported reusable DAX measures and revealed 37% higher Wholesale order value and 77% revenue concentration in Australia and Brazil.
  • Discount percentage showed only 0.17 correlation with boxes shipped.
  • The validated model kept product, customer, geography and time analysis consistent across the report.
PythonPower BIDAXStar SchemaData Quality
Open repository
Retail Sales Performance: Analytics architecture06
Figures01 / 03
Analytics architecture
Decision-focused analytics

Retail Sales Performance

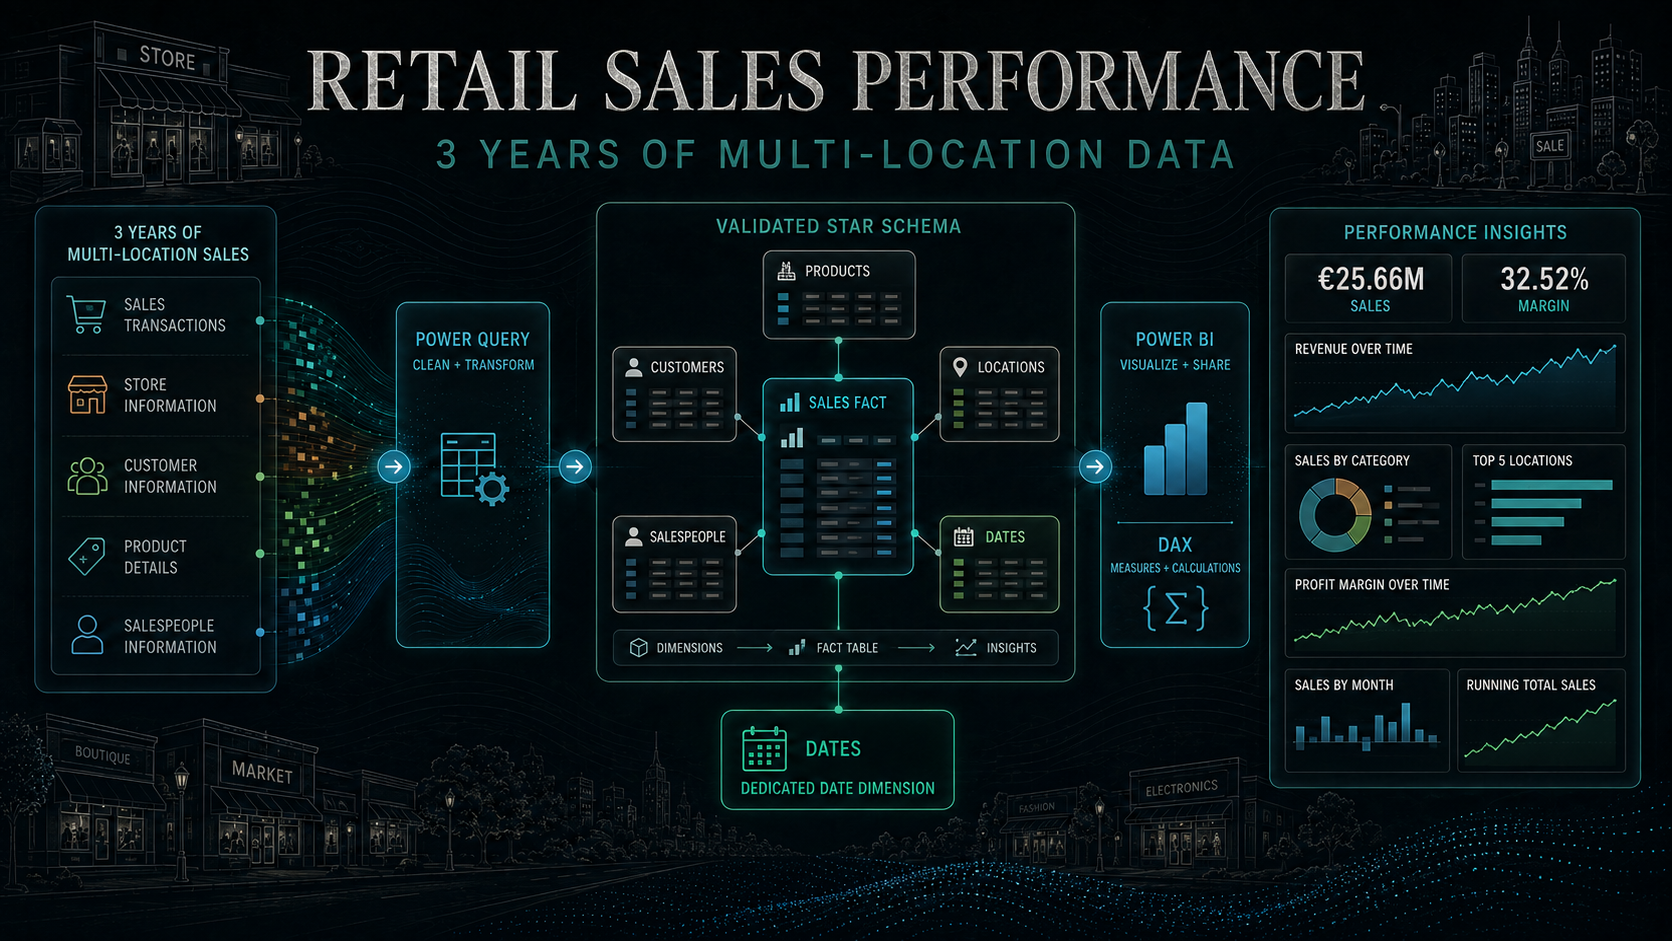
Three years of multi-location sales modelled into a six-table star schema with DAX measures for revenue, cost, margin, YoY performance and running totals.

The challenge

Keeping year-over-year and running-total calculations accurate across locations, customers and products.

The solution

Introduced a dedicated date dimension so time intelligence remained correct, reusable and filter-aware.

Signals, outcomes & lessons

Retail Sales Performance modelled three years of multi-location activity in a six-table star schema, enabling reusable time intelligence across €25.66M in sales and a reported 32.52% margin.

Architecture & data flow

Power Query standardizes three years of multi-location data before a Sales fact connects to Products, Locations, Customers, Salespeople and a dedicated Dates dimension. DAX measures layer revenue, cost, margin, YoY and running totals over the semantic model.

Learning outcomes
  • Six-table star-schema design for multi-location sales analysis.
  • Reusable DAX measures for revenue, cost, margin and time intelligence.
  • Power Query preparation with a dedicated, filter-aware date dimension.
Evidence at a glance

3 yrs sales history modelled · 6 tables in the star schema · 32.52% reported gross margin

Signals, outcomes & lessons
  • Retail Sales Performance modelled three years of multi-location activity in a six-table star schema, enabling reusable time intelligence across €25.66M in sales and a reported 32.52% margin.
  • Los Angeles County led with €1.80M, more than twice the next county.
  • Margins remained near 32 to 33% despite monthly revenue variation.
Power BIPower QueryDAXData Modelling
Open repository
Cultural Heritage Tourism: Project overview07
Figures01 / 05
Project overview
Sustainability data modelling

Cultural Heritage Tourism

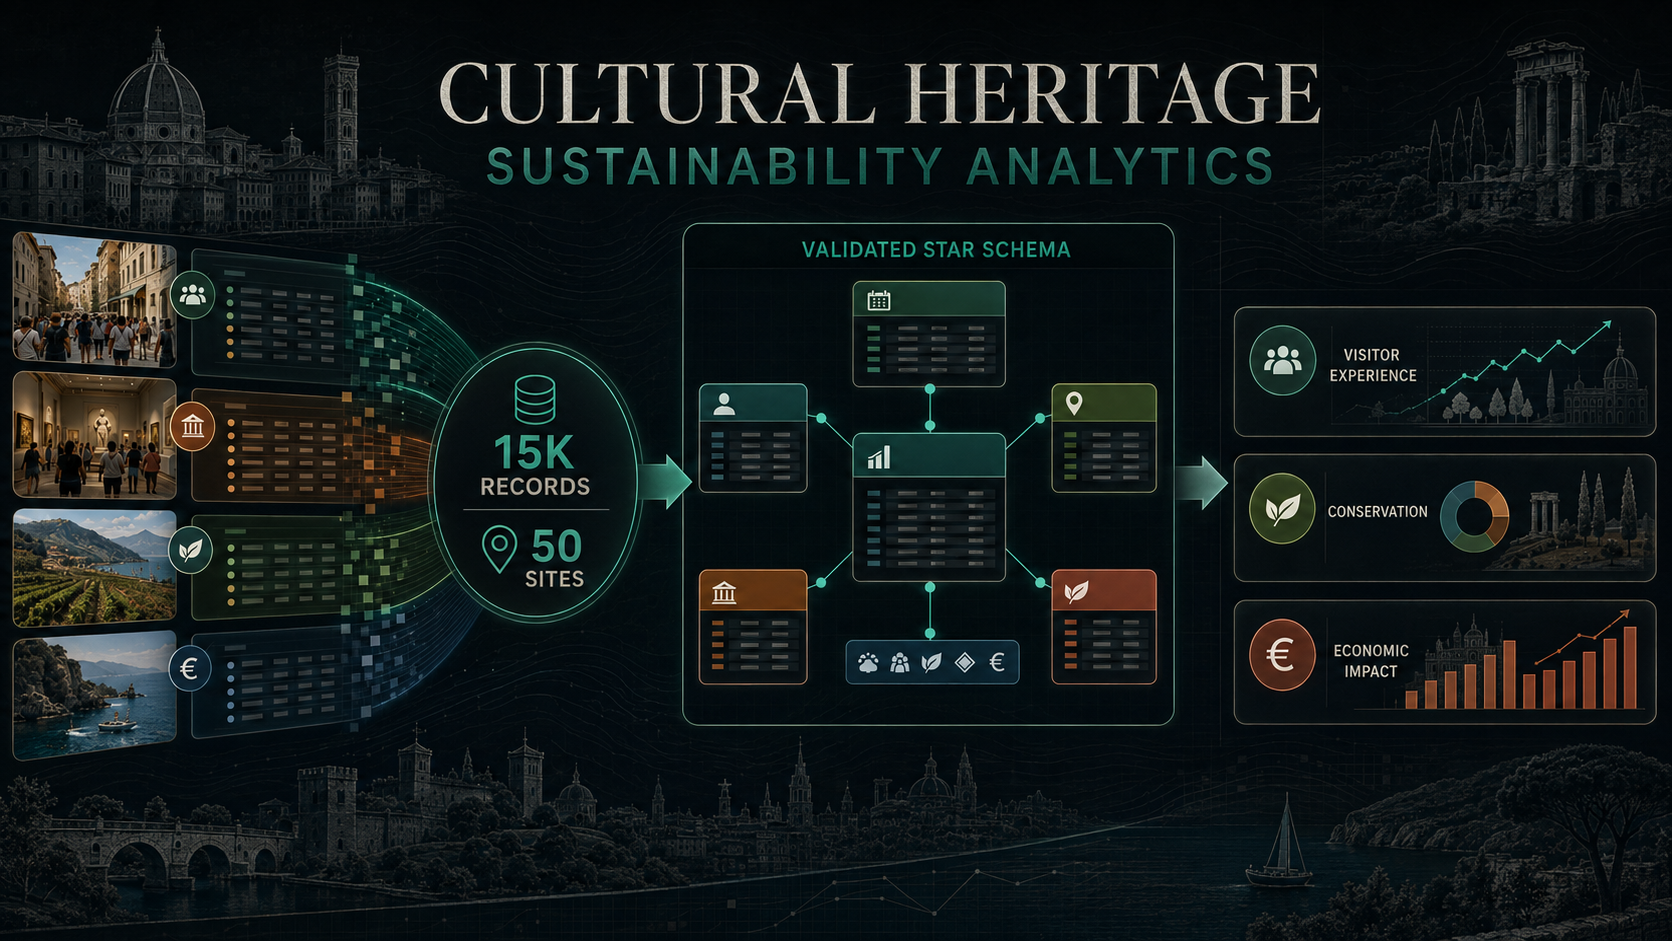
An evidence-led sustainability analytics project that reconciles tourism demand, conservation risk and visitor experience across 15,000 records from 50 heritage sites. It corrects flawed categorical assumptions, preserves site-level context and gives decision-makers a reliable way to compare economic value, overcrowding, environmental pressure and maintenance needs.

The challenge

A technically valid GROUP BY model collapsed every site to the same categorical values.

The solution

Replaced the false fixed-site dimensions with a junk dimension, then enforced keys and relationships in a validated star schema.

Signals, outcomes & lessons

Cultural Heritage Tourism validated 15K records across 50 sites and rebuilt a flawed categorical model into a trustworthy star schema that connected tourism demand, conservation risk and visitor experience.

Architecture & data flow

T-SQL stages and validates the source, builds fact and dimension tables with foreign keys, and serves a Power BI semantic model with statistical DAX measures.

Learning outcomes
  • Validating categorical assumptions before dimensional modelling.
  • Using a junk dimension for changing site attributes.
  • Building statistical DAX measures beyond simple aggregation.
Evidence at a glance

15K validated source records · 50 heritage sites compared · 3 decision-focused dashboards
Signals, outcomes & lessons
  • Cultural Heritage Tourism validated 15K records across 50 sites and rebuilt a flawed categorical model into a trustworthy star schema that connected tourism demand, conservation risk and visitor experience.
  • Overcrowding strongly reduced visitor satisfaction (r = -0.78).
  • Maintenance spend tracked damage severity (r = 0.93), while environmental impact tracked visitor volume (r = 0.95).
SQL ServerT-SQLPower BIDAXStar Schema
Open repository